Introduction
Suppose a business owes you $3,000 and offers you two repayment choices: (1) it will give you three payments of $1,000 each at the end of years 2026, 2027, and 2028, or (2) it will give you the total $3,000 at the beginning of the year 2026. Which repayment option should you choose? To maximize your dollars, you should choose the one that gives you the largest present value—in this case, option #2.
If you receive and invest $100 today, it will grow over time to be worth more than $100. This fact of financial life is a result of the time value of money, a concept which says it’s more valuable to receive $100 now rather than a year from now. It also means that receiving $100 one year from now is less valuable than receiving that same $100 today. In other words, the $100 received one year from now has a present value that is smaller than $100.
Ordinary Annuity
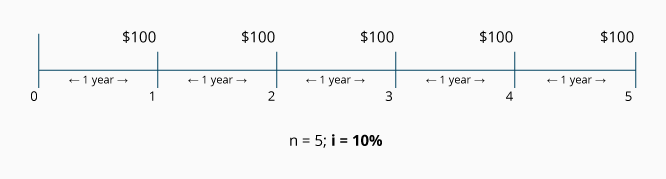
An annuity is a series of identical payments occurring at equal time intervals. When the payments appear at the end of each time period, the annuity is said to be an ordinary annuity or an annuity in arrears. The following timeline depicts an ordinary annuity comprised of five payments of $100 each:

The equal periods of time (represented by n) between the identical payments of $100 could be a year, a 6-month period, a quarter of a year, a month, etc. In the above example, n = 5 periods of one year each. The interest rate (represented by i) is used to discount the $100 payments to time period 0. The interest rate might be the company’s required rate, its target rate, its cost of capital, etc. The $100 amounts are often represented by either the letters “PMT” (for “payment” or receipt) or as “rent” (since the amount is the same each period).
We are going to focus here on ordinary annuities—annuities with equal payments occurring at the end of each period (as shown in the above timeline). Annuities due or annuities in advance—annuities with the equal payment amounts occurring at the beginning of each period—will be another topic.)
WATCH NOW
Advance Your Career with Our PRO Training
Accounting Applications
Accountants use present value calculations of an ordinary annuity in a number of applications. For example:
-
Your company provides a service in December 2025 and agrees to be paid in three installments of $100 each. The payments will occur at the end of each of the years 2026, 2027, and 2028. The time value of money tells us that a portion of the three $100 payments represents interest your company will earn because it has agreed to wait for its money. It may be that only $250 of the total $300 in payments can be considered service revenue earned in 2025; the remaining $50 is interest revenue earned over the three years 2026, 2027, and 2028. How do you determine what amount is actual service revenue and what amount is implicit interest revenue? By using a present value calculation, you can remove the implicit interest so that the amount of service revenue can be determined.
-
Your company is interested in buying the parcel of land adjacent to its present site. The owners will either sell the land to you for $380,000 today, or they will sell it to you for five payments of $100,000 each over the next five years. (The payments will be one year apart with the first payment due one year from now.) Which arrangement makes the most financial sense to your company? By using a present value calculation, you can determine the interest rate implicit in the five-payment arrangement.
In addition to these two examples, we will see that present value calculations can also tell you such things as how much money to invest now in return for specific cash amounts to be received in the future, and how to estimate the rate of return on your investments. Our focus throughout this topic will be on ordinary annuities—streams of equal cash amounts that are received or paid at the end of future periods. We’ll discuss calculations that determine present value, interest rate, and/or the length of time needed for identical payments to occur.
Components of a Present Value Calculation
In present value calculations, future cash amounts are discounted back to the present time. (“Discounting” means removing the interest that is imbedded in the future cash amounts.) As a result, present value calculations are often referred to as a discounted cash flow technique. It’s important for you to understand that present value calculations involve cash amounts—not accrual accounting amounts.
Present value calculations involve the compounding of interest. This means that any interest earned is reinvested and will earn interest at the same rate as the principal. In other words, you earn “interest on interest.” The compounding of interest can be very significant when the interest rate and/or the number of years are sizable.
The present value of an annuity (i.e., series of equal payments, receipts, rents) involves five components:
- Present value
- Amount of each identical cash payment
- Time between the identical cash payments
- Number of periods that the payments will occur; length of the annuity
- Interest rate or target rate used for discounting the series of payments*
* This rate (represented by i) could be a loan interest rate, but it could also be a company’s minimum rate of return to be earned on each investment.
If you know any four of these five components, you will be able to calculate the unknown component.
Present Value of an Ordinary Annuity (PVOA)
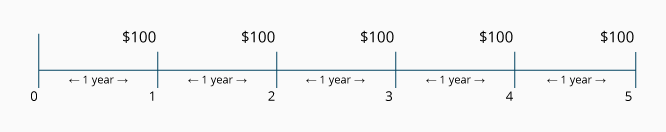
Ordinary annuities are also known as annuities in arrears. These annuities are characterized by recurring, identical, cash payment amounts (payments, receipts, rents) at the end of each equal period. The following timeline illustrates a 5-year ordinary annuity with payments of $100 occurring at the end of each year:

Examples of ordinary annuities include:
-
An automobile loan taken out on May 25, 2026 requires a monthly payment of $300 for 48 months beginning on June 25, 2026.
-
A mortgage loan dated June 1, 2026 requires a payment of $943 on the first day of each month for 180 months beginning on July 1.
-
The interest payments on a bond payable issued on May 1, 2026 requires $10,000 of interest be paid every November 1 and May 1 for the life of the bond.
-
A commitment made on January 1, 2026 requires $1,000 be paid each December 31 for five years.
Visualizing the Present Value of an Ordinary Annuity (PVOA)
In order to calculate the present value of an ordinary annuity (PVOA), you need to know the other four components mentioned above:
- Amount of each identical cash payment
- Time between the identical cash payments
- Number of periods that the payments will occur
- Interest rate used for discounting the series of payments
Let’s assume that on May 1, 2026, you are asked to determine the present value of a series of $1,000 receipts. The receipts will be received each year on May 1 beginning in 2027 and ending in 2031. The appropriate rate for discounting the $1,000 amounts is 12% per year. If we insert the known and unknown amounts onto a timeline, we minimize the potential for making an error:

Visualizing the Recurring Identical Payments (PMT)
Often we know the present value, the number of payments, and the interest rate, but we do not know the amount of the recurring payments. For example, we may want to calculate the amount of a monthly loan payment if we borrowed $25,000 for five years; or a recent retiree may want to know how much could be withdrawn every six months for twenty years from a fixed account earning 5% interest.
Let’s look at an example. Assume that on June 1, 2026, your savings account has a present value of $8,530 and it earns interest at the semiannual rate of 3% (approximately 6% per year). Beginning on December 1, 2026, you want to withdraw an equal amount of cash each December 1 and June 1 so that at the end of 5 years the account balance is zero. What will be the amount of your semiannual withdrawals?
Let’s construct a timeline to help determine the amount of each semiannual withdrawal or payment (PMT):

Using an alternative scenario, this timeline could be used to describe a present debt amount of $8,530 that needs to be paid off with 10 semiannual loan payments and a loan interest rate of 6% per year (3% semiannually).
Visualizing the Number of Periods (n)
In some instances, you may need to determine the number of payments in an ordinary annuity. For example, for how many months could you withdraw $100 from an investment account with a present value of $2,581, if the fund earns 12% per year compounded monthly. The fund begins on June 1, 2026 and the first monthly withdrawal takes place on July 1, 2026.
The following timeline summarizes the information:
Using an alternative scenario, this timeline could depict the number of periods it would take to pay off a present loan balance of $2,581 with an interest rate of 1% per month and monthly payments of $100.
Visualizing the Interest Rate (i)
The interest rate (i) could be the interest rate in a loan, but it could also be a company’s cost of capital, a targeted rate the company must earn on its investment, or it could be the actual rate of return being earned.
In some situations, you know the present value of an ordinary annuity, the recurring identical payment amounts, the time interval between the payments, and the length of the annuity. You are asked to determine the interest rate (i) or the rate of return in the annuity.
To illustrate, let’s assume that an annuity consists of four payments of $100 each and they will occur on July 1 of each year beginning in 2027. The present value on July 1, 2026 is $317. You are asked to determine the interest rate (or rate of return) involved in this arrangement. To aid in visualizing this annuity, you prepare the following timeline:

Using an alternative scenario, this timeline could be used to depict a situation in which your company has the choice of purchasing an item today for $317, or paying $100 in four annual installments (with the first payment due in one year). You are asked to determine the interest rate that your company would be paying under the four-payment option.
Present Value Formulas, Tables and Calculators
The easiest and most accurate way to calculate the present value of any future amounts (single amount, varying amounts, annuities) is to use an electronic financial calculator or computer software. Some electronic financial calculators are now available for less than $35.
IMPORTANT! Understand that each financial calculator operates differently and may operate in a manner that is different from our Explanation. Be certain to read and thoroughly understand the directions before operating any calculator or computer software. One incorrect assumption, one incorrect input, or the use of a button that works differently from what you assumed, will mean an incorrect answer—and that could have a significant financial consequence!
If you don’t have access to an electronic financial calculator or software, an easy way to calculate present value amounts is to use present value tables (PV tables). PV tables cannot provide the same level of accuracy as financial calculators or computer software because they use factors that are rounded off to fewer decimal places. In addition, they usually contain a limited number of choices for interest rates and time periods. Despite this, present value tables remain popular in academic settings because they are easy to incorporate into a textbook. Because of their widespread use, we will use present value tables for solving our examples.
Behind every table, calculator, and piece of software, are the mathematical formulas needed to compute present value amounts, interest rates, number of periods, payment amounts, and other future value amounts. We will use present value tables throughout our explanation.
Except for minor differences due to rounding, answers to the exercises below will be the same whether they are computed using a financial calculator, computer software, PV tables, or formulas.
Using the PVOA Table
If you don’t have access to an electronic financial calculator or software, an easy way to calculate present value amounts is to use present value tables. You can view a present value of an ordinary annuity table by clicking PVOA Table.
The first column (n) refers to the number of recurring identical payments (or periods) in an annuity. The other columns contain the factors for the interest rate (i) specified in the column heading. The point where a particular interest rate (i) intersects a particular number of payments (n) is the annuity’s PVOA factor. When you multiply this factor by the annuity’s recurring payment amount, the result is the present value of the annuity.
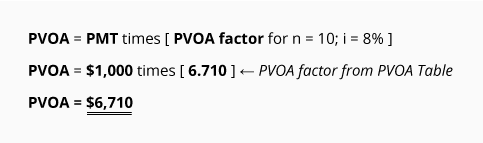
If you know an annuity is discounted at 8% per period and there are 10 periods, look on the PVOA Table for the intersection of i = 8% and n = 10. You will find the factor 6.710. Once you know the factor, simply multiply it by the amount of the recurring payment; the result is the present value of the ordinary annuity.
Let’s demonstrate the use of the PVOA factors. If an ordinary annuity consists of 10 payments of $1,000 each and the interest rate for discounting is 8%, the present value of the ordinary annuity is:

If you are familiar with our Present Value of a Single Amount Explanation, you will notice that the result here is the same as if we had discounted each of the $1,000 payments by using a PV of 1 Table and then summed the ten present value amounts. Rather than doing those ten calculations, however, the PVOA Table has combined for us the 10 factors from the PV of 1 Table—this allows us to compute the present value with just one multiplication. Note that this is possible only when each of the ten payments is identical in amount. (If the ten payments varied in amount, we could not use the annuity table; we would have to calculate the present value of a single amount for each of the ten payments and then sum the ten present value amounts.)
Calculating the Present Value of an Ordinary Annuity (PVOA)
In this section we will solve four exercises that calculate the present value of an ordinary annuity (PVOA). We will use PMT (“payment”) to represent the recurring identical cash payment amount.
Exercise #1
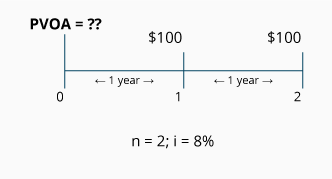
Let’s assume we are to receive $100 at the end of each year for two years. How do we calculate the present value of this annuity, assuming the interest rate or the required rate for discounting is 8% per year compounded annually?
The following timeline depicts the information we know, along with the unknown component (PVOA).

Because each payment is the same amount ($100) and because there is an equal length of time between payments (one year in this example), we know this arrangement meets the definition of an annuity. Because the equal payments occur at the end of each year, we know we have an ordinary annuity.
Calculation of Exercise #1 using the PVOA Table
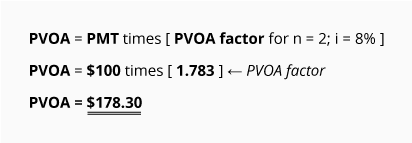
The equation for calculating the present value of an ordinary annuity is:

This PVOA calculation tells you that receiving $178.30 today is equivalent to receiving $100 at the end of each of the next two years, if the time value of money is 8% per year. If the 8% rate is a company’s required rate of return, this tells you that the company could pay up to $178.30 for the two-year annuity.
[The $178.30 could have been computed by using the PV of 1 Table for the two payments. In other words, receiving $100 at the end of the first year has a present value of $92.60 ($100 times 0.926, the PV of 1 factor for n = 1; i = 8%). Receiving the second $100 at the end of the second year has a present value of $85.70 ($100 times 0.857, the PV of 1 factor for n = 2; i = 8%). The total of those two present values ($92.60 + $85.70) equals $178.30.]
The difference between the $200 of total future payments and the present value of $178.30 is the interest our money earns while we wait to receive the payments. This $21.70 difference is referred to as interest, discount, or a company’s return on its investment.
Exercise #2
Determine the present value (the value at period 0) of receiving a series of equal payments of $200 at the end of each year for 20 years. Assume that today is June 1, 2026 and that the first payment will occur on June 1, 2027. The appropriate rate for discounting the payments is 10% per year compounded annually.

Calculation of Exercise #2 using the PVOA Table
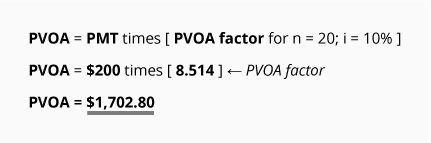
The equation for calculating the present value of an ordinary annuity is:

This calculation tells you that receiving $1,702.80 today is equivalent to receiving $200 at the end of each of the next 20 years, if the time value of money is 10% per year. (Obviously, using the PVOA Table is a great time saver compared to the 20 calculations that would be required if you used the PV of 1 Table for each $200 payment.)
Given an interest rate of 10%, the difference between the present value of $1,702.80 and the $4,000.00 of total payments (20 payments at $200 each) reflects the interest earned over the years. This difference of $2,297.20 ($4,000 minus $1702.80) is referred to as interest, or discount.
Exercise #3
What is the present value of receiving a series of $300 payments at the end of each quarter for three years, if the time value of money is 8% per year? Assume that today is June 1, 2026 and that the quarterly payments will begin on September 1, 2026.
As we can see from the timeline, this is an ordinary annuity; the payment amounts are identical, they occur at equal time intervals, and they occur at the end of each 3-month period.
Calculation of Exercise #3 using the PVOA Table
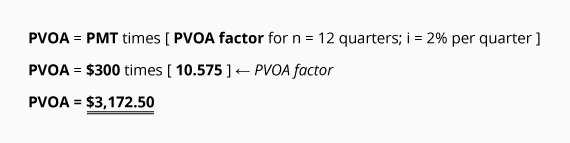
The equation for calculating the present value of an ordinary annuity is:

This calculation tells us that receiving $3,172.50 today is equivalent to receiving $300 at the end of each of the next 12 quarters, if the time value of money is 2% per quarter (or 8% per year).
If 8% is a firm’s targeted rate of return per year, this calculation tells us that the company can pay up to $3,172.50 for the stream of $300 payments. (If it pays more than $3,172.50 it will earn less than its required rate of 8%.)
Exercise #4
What is the maximum amount you borrow on June 1, 2026 if you are limited to a two-year loan with monthly payments of $400? Assume the loan will have an annual interest rate of 12%. The first payment will be due on July 1, 2026.
Calculation of Exercise #4 using the PVOA Table
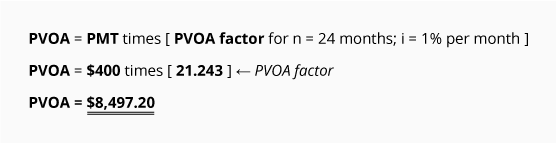
The equation for calculating the present value of an ordinary annuity is:

Assuming the interest rate is 12% per year (or 1% per month), $8,497.20 is the present value amount that you could borrow today if you were to make 24 monthly payments of $400 each starting at the end of the first month. You can see the proof of this amount by reviewing the loan amortization schedule for this scenario:

The above calculation tells us that receiving $8,497.20 today is equivalent to receiving $400 at the end of each of the next 24 months, if the time value of money is 1% per month (or 12% per year). It also means that a company requiring a 12% annual return compounded monthly can invest up to $8,497.20 for this annuity of $400 payments.
Calculating the Payment in an Ordinary Annuity (PMT)
Present value calculations allow us to determine the amount of the recurring payments in an ordinary annuity if we know the other components: present value, interest rate, and the length of the annuity. Exercises 5 and 6 will demonstrate how to solve for the payment amount.
Exercise #5
On June 1, 2025, Grandma deposited $1,733 into an account to help pay for Emily’s summer volleyball camp for four consecutive years. The first camp is scheduled for June 2026. The account earns 6% interest per year, compounded annually. The interest earned on the account balance is deposited into the account on May 31 of each year. If Grandma wants the balance to be $0 at the end of the four years, how much should she withdraw for Emily each June?
The following timeline helps us visualize the facts:

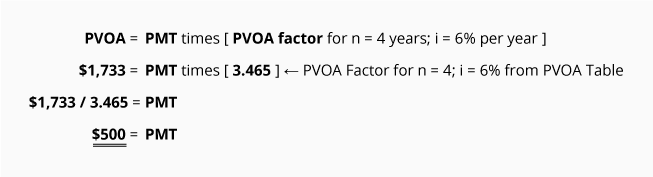
Calculation of Exercise #5 using the PVOA Table
Using the above information and factors from our PVOA Table, we can solve for the unknown payment amount (PMT) as follows:

We use simple algebra and the appropriate present value factor to determine that Grandma can withdraw $500 each June 1 beginning in 2026.
The following table shows the account activity, confirming that $500 can be withdrawn each year for four years:

Exercise #6
Your company plans to borrow $10,152 on January 1, 2026. You would like to repay the loan by making six semiannual loan payments beginning on June 30, 2026. The payments will be equal amounts and will cover a portion of both the interest (10% per year compounded semiannually) and the principal repayment. The payments will be paid on each June 30 and December 31. What will be the amount of each of the six payments?
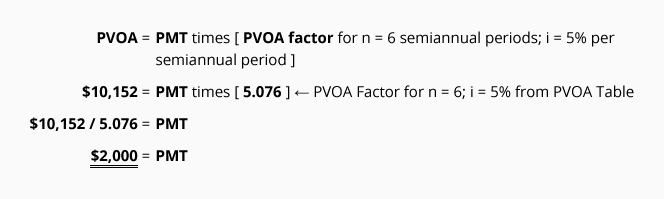
Calculation of Exercise #6 using the PVOA Table
Our first step is to construct a timeline to organize the information:

Using the above information and factors from our PVOA Table, we can solve for the unknown payment amount (PMT) with the following equation:

We use simple algebra and the appropriate present value factor to determine that each of the six payments will be $2,000. The first payment will be made on June 30, 2026 and the final payment will occur on December 31, 2028.
The following loan amortization schedule shows the amount of interest and principal contained in each loan payment and confirms that the loan will be paid by December 31, 2028.

Calculating the Length of an Ordinary Annuity (n)
We can use present value calculations to determine the number of periods (or payments) in an ordinary annuity if we know the other components: present value, interest rate, and the amount of each recurring payment. Exercises 7 and 8 below demonstrate how to solve for the number of periods (or payments).
Exercise #7
Janine has an investment account with a present value of $5,053. The account earns interest at 6% per year compounded annually. She intends to withdraw $500 at the end of each year. Assume that the present time (period 0) is January 1, 2026 and the first withdrawal will take place on December 31, 2026. How many withdrawals can Janine make before her account balance shrinks to $0?

Calculation of Exercise #7 using the PVOA Table
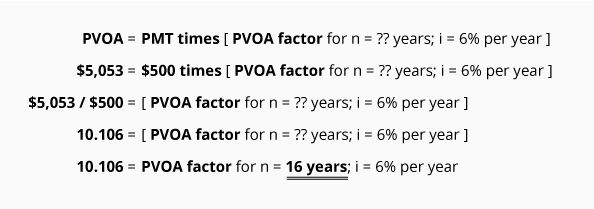
Solving for n (the number of periods/payments in an ordinary annuity) is done with the following equation:

Let’s review this calculation. We insert into the equation the components that we know: the present value, the interest rate, and the recurring payment amount. In line four, we calculate our factor to be 10.106. We now know both the PVOA factor (10.106) and the interest rate (6%). We go to the PVOA Table and look down the 6% interest column until we come to the factor 10.106. Tracking across the row, we see that at this point, n = 16. Since the periods in question are annual periods, the answer is 16 years.
Here is the proof of this calculation:

Exercise #8
Jeremy borrows $4,461 at an interest rate of 8% per year, compounded semiannually on each July 1 and January 1. He plans to make a $600 loan payment at the end of each semiannual period. Assuming that the present time (period 0) is January 1, 2026 and the first loan payment will take place on July 1, 2026, when will the loan balance be $0?
Calculation of Exercise #8 using the PVOA Table
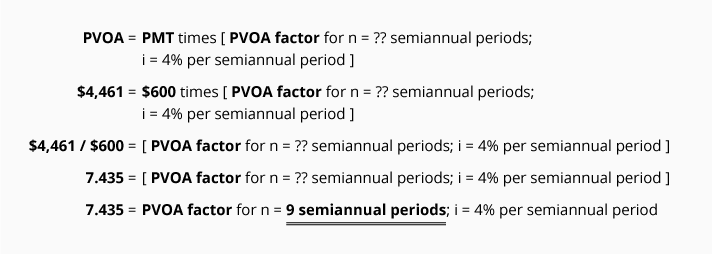
The number of semiannual periods/payments in the ordinary annuity can be computed with the PVOA equation:

Let’s review this calculation. We insert into the equation the components that we know: the present value, the interest rate, and the recurring payment amount. In line four, we calculate our factor to be 7.435. We now know both the PVOA factor (7.435) and the interest rate (4%). We go to the PVOA Table and look down the 4% interest column until we come to the factor 7.435. Tracking across the row, we see that at this point, n = 9. Since the periods in question are semiannual periods, the answer is 9 semiannual periods.
The question we were asked is “when will the loan balance be $0?” The answer is July 1, 2030.
Here is the proof of this calculation:

Calculating the Rate (i) in an Ordinary Annuity
Using the PVOA equation, we can calculate the interest rate (i) needed to discount a series of equal payments back to the present value. In order to solve for (i), we need to know the present value amount, the amount of the equal payments, and the length of time (n).
Exercise #9
Sylvia has an investment account that shows a balance of $2,523.50 on January 1, 2026. She wants to make five withdrawals of $700 each on December 31 of years 2026 through 2030. Sylvia wants the account to have a balance of $0 on December 31, 2030. In order to proceed with her plans, what annual interest rate does Sylvia need on her account, assuming that annual interest earnings are added to the principal on December 31 of each year?

Calculation of Exercise #9 using the PVOA Table
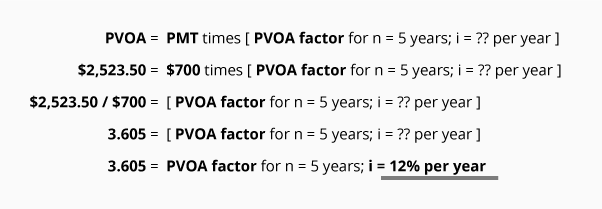
The interest rate for the ordinary annuity described above can be computed with the following equation:

Let’s review this calculation. We insert into the equation the components that we know: the present value, payment amount, and the number of periods. In line four, we calculate our factor to be 3.605. We now know both the PVOA factor (3.605) and the number of years (n = 5). We go to the PVOA Table and look across the n = 5 row until we come to the factor 3.605. Tracking up the column, we see that the factor is in the column with the heading of 12%. Since the periods in question are annual periods, the answer of i = 12% means the investment has to earn 12% per year.
Here is the proof of this answer:

Exercise #10
Matt is moving to Texas and needs to borrow $5,616 on January 1, 2026. His budget will allow him to make quarterly payments of $800 on the first day of January, April, July, and October. Matt’s loan includes 8 quarterly payments with the first payment due on April 1, 2026. What is the rate (compounded quarterly) that Matt will be paying (and the lender will be receiving) under this arrangement?
Before calculating the interest rate, we organize the information on a timeline:
Calculation of Exercise #10 using the PVOA Table
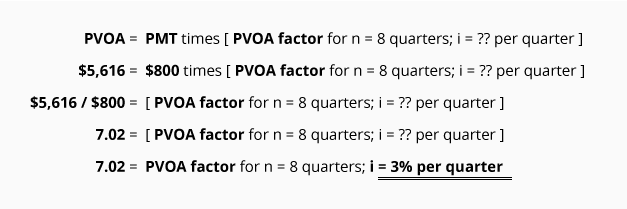
The number of periods/payments in the ordinary annuity described above can be computed with the following PVOA equation:

Let’s review this calculation. We insert into the equation the components that we know: the present value, the recurring payment amount, and the number of periods. In line four, we calculate our factor to be 7.02. We now know both the PVOA factor (7.02) and the number of periods (n = 8). We go to the PVOA Table and look across the n = 8 row until we come to the factor 7.02. Tracking up the column, we see that we are in the 3% column. Since the periods in question are quarterly periods, the answer of i = 3% means the loan has an annual rate of 12% per year (3% times 4 quarters per year).
Here is the proof of this calculation:

PVOA Used in Recording a Transaction and Amortizing Discount
Let’s illustrate how the calculation of the present value of an annuity is used in recording an accounting transaction.
Exercise #11
On December 31, 2025, FreshStart provided a service for its customer DownCo in exchange for a promissory note requiring five annual payments of $1,000 each. The payments are to occur on December 31 of each year beginning on December 31, 2026. The note does not specify any interest, and there is no market for the note. The value of the service provided by FreshStart is very unique and no market value is available. Based on the credit worthiness of DownCo and the length of the note, it is estimated that DownCo would have to pay 10% interest if it borrowed a similar amount from a bank. As FreshStart’s accountant, how would you record the transaction on December 31, 2025?
Both the cost principle and the revenue recognition principle prohibit you from recording the $5,000 as December 2025 revenue, since a portion of the $5,000 is interest that will be earned in the five years 2026 through 2030. Since there is no fair market value (or cash equivalent amount) known for the note or for the service provided, you realize that the present value (or cash equivalent amount) of the note must be computed.
Your first step is to prepare a timeline that displays the relevant facts:

Calculation of Exercise #11 using the PVOA Table
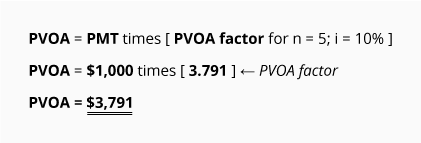
Using the information on the timeline, you insert the known figures into the PVOA equation:

This calculation tells you that receiving $1,000 at the end of each of the next 5 years is the equivalent of $3,791 at the present time if the time value of money is 10% per year. The difference between $3,791 and the future amounts aggregating $5,000 (5 payments at $1,000 each) is $1,209. This $1,209 is interest that will be earned by FreshStart over the next five years. Expressed another way, FreshStart earned only $3,791 in service revenues from DownCo on December 31, 2025.
A proof of this calculation is shown below:

FreshStart’s journal entry to record this transaction on December 31, 2025 is:

The $1,209 in Discount on Notes Receivable is to be amortized from this balance sheet account to the income statement account Interest Revenues over the life of the note.
If the discount and resulting interest revenue is immaterial in light of FreshStart’s income statement, the discount can be amortized by using the straight-line method. Under the straight-line method, $241.80 ($1,209 divided by 5 years) will be recorded in each of the years 2026 through 2030, as shown in the following entry:

However, if the discount and resulting interest revenue is material (significant) in light of FreshStart’s income statement, generally accepted accounting principles requires that the discount be amortized by the effective interest rate method. The amounts for the effective interest rate method appear in the Interest Payment column of the Loan Amortization Schedule and are used in the following journal entries:

After posting these journal entries, the book value (or carrying value) of this note receivable can be determined from the balances in the following T-accounts:

The book value (or carrying value) of the notes receivable is calculated as shown here:

Note that the book value amounts in the above exhibit are the same as the principal balance amounts in the Loan Amortization Schedule for $3,791. If the notes receivable was written for $3,791 with a stated interest of 10% and annual payments of $1,000, the journal entries would have been:

Where to Go From Here
We recommend taking our Practice Quiz next, and then continuing with the rest of our Present Value of an Ordinary Annuity materials (see the full outline below).
We also recommend joining PRO to unlock our premium materials (certificates of achievement, video training, flashcards, visual tutorials, quick tests, quick tests with coaching, cheat sheets, guides, puzzles, business forms, printable PDF files, progress tracking, badges, points, medal rankings, activity streaks, public profile pages, and more).
Disclaimer
You should consider our materials to be an introduction to selected accounting and bookkeeping topics (with complexities likely omitted). We focus on financial statement reporting and do not discuss how that differs from income tax reporting. Therefore, you should always consult with accounting and tax professionals for assistance with your specific circumstances.